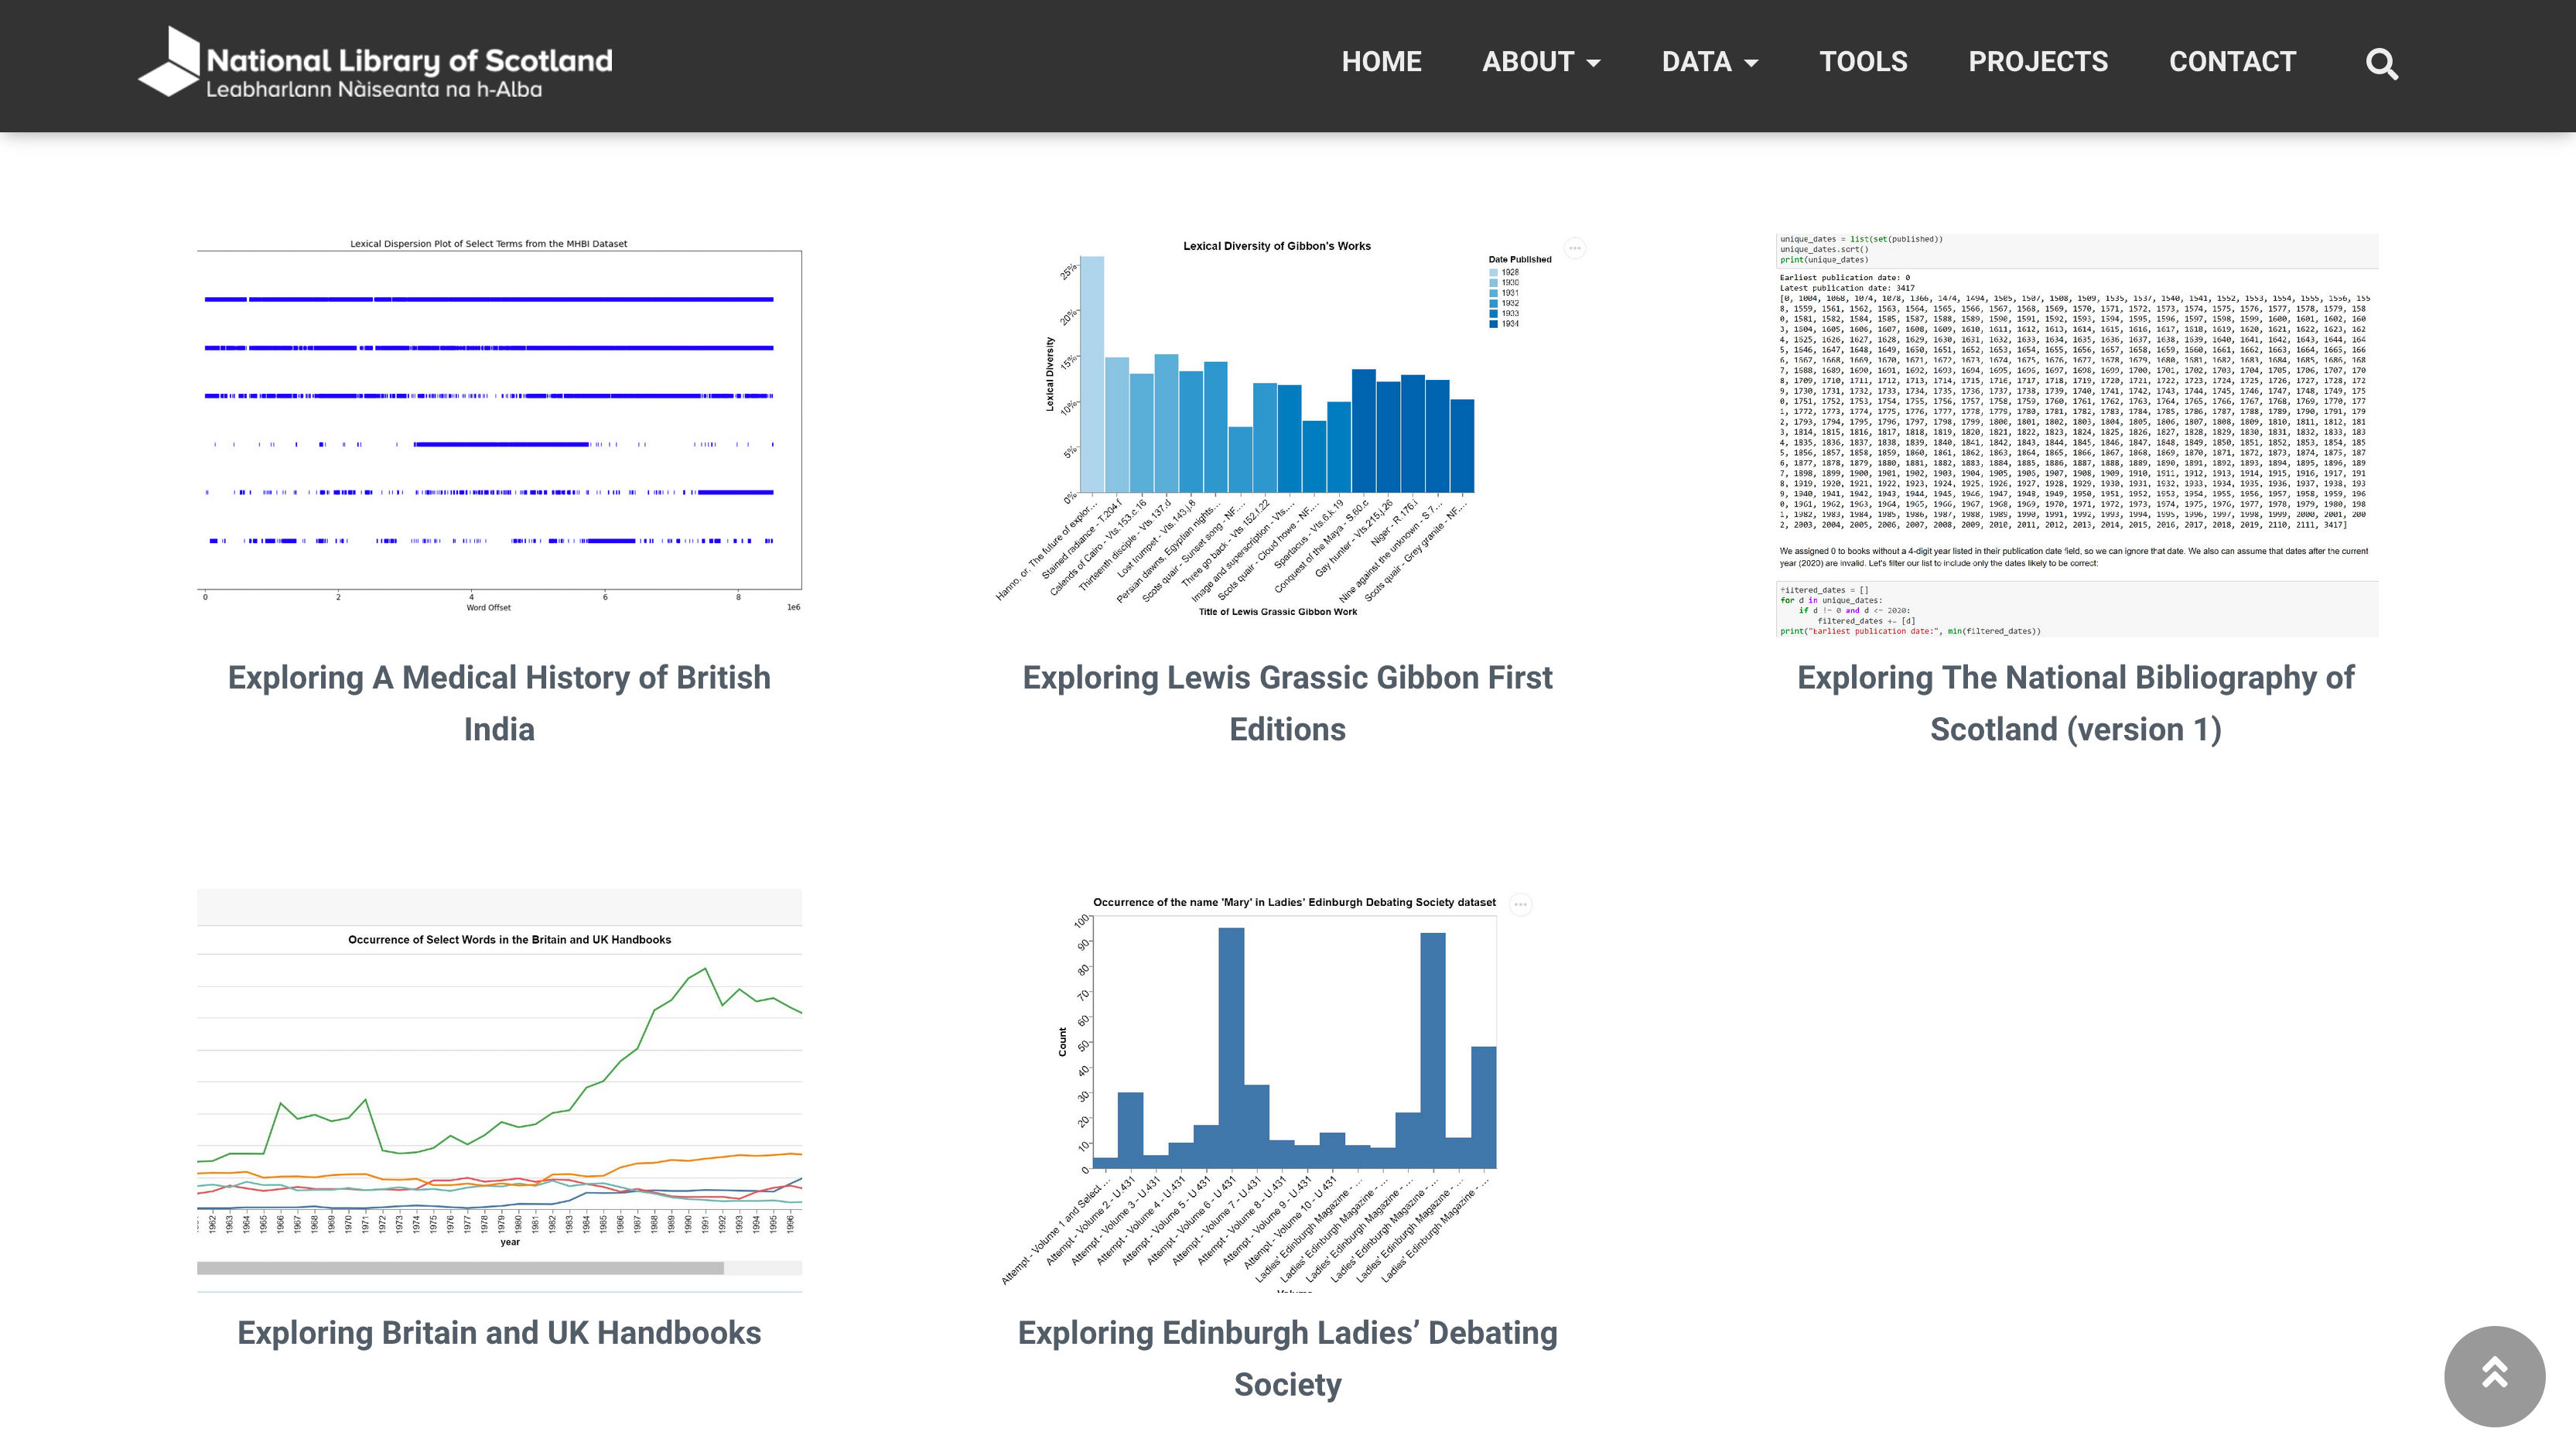
Contextualizing library items during the search process
Exploratory data visualization as an alternative to search bars
DATA VISUALIZATION | USER INTERFACE DESIGN
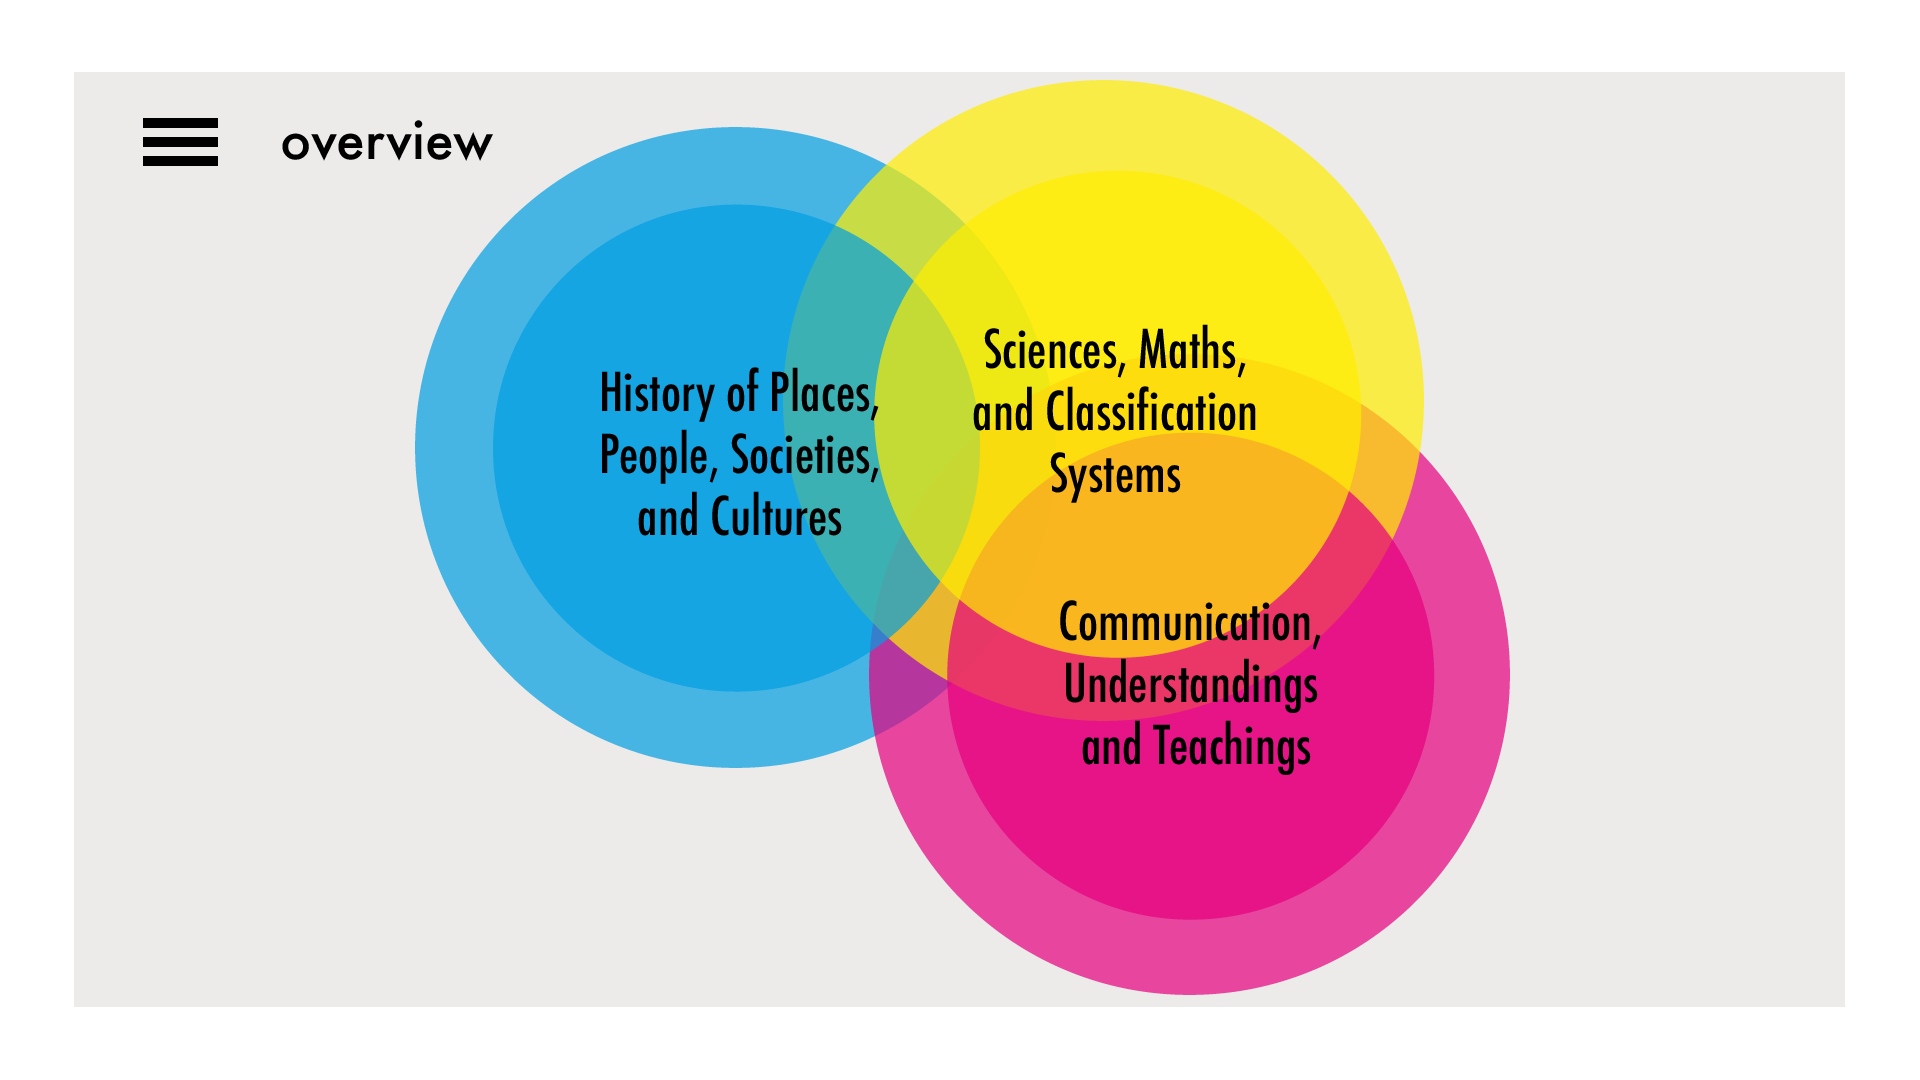
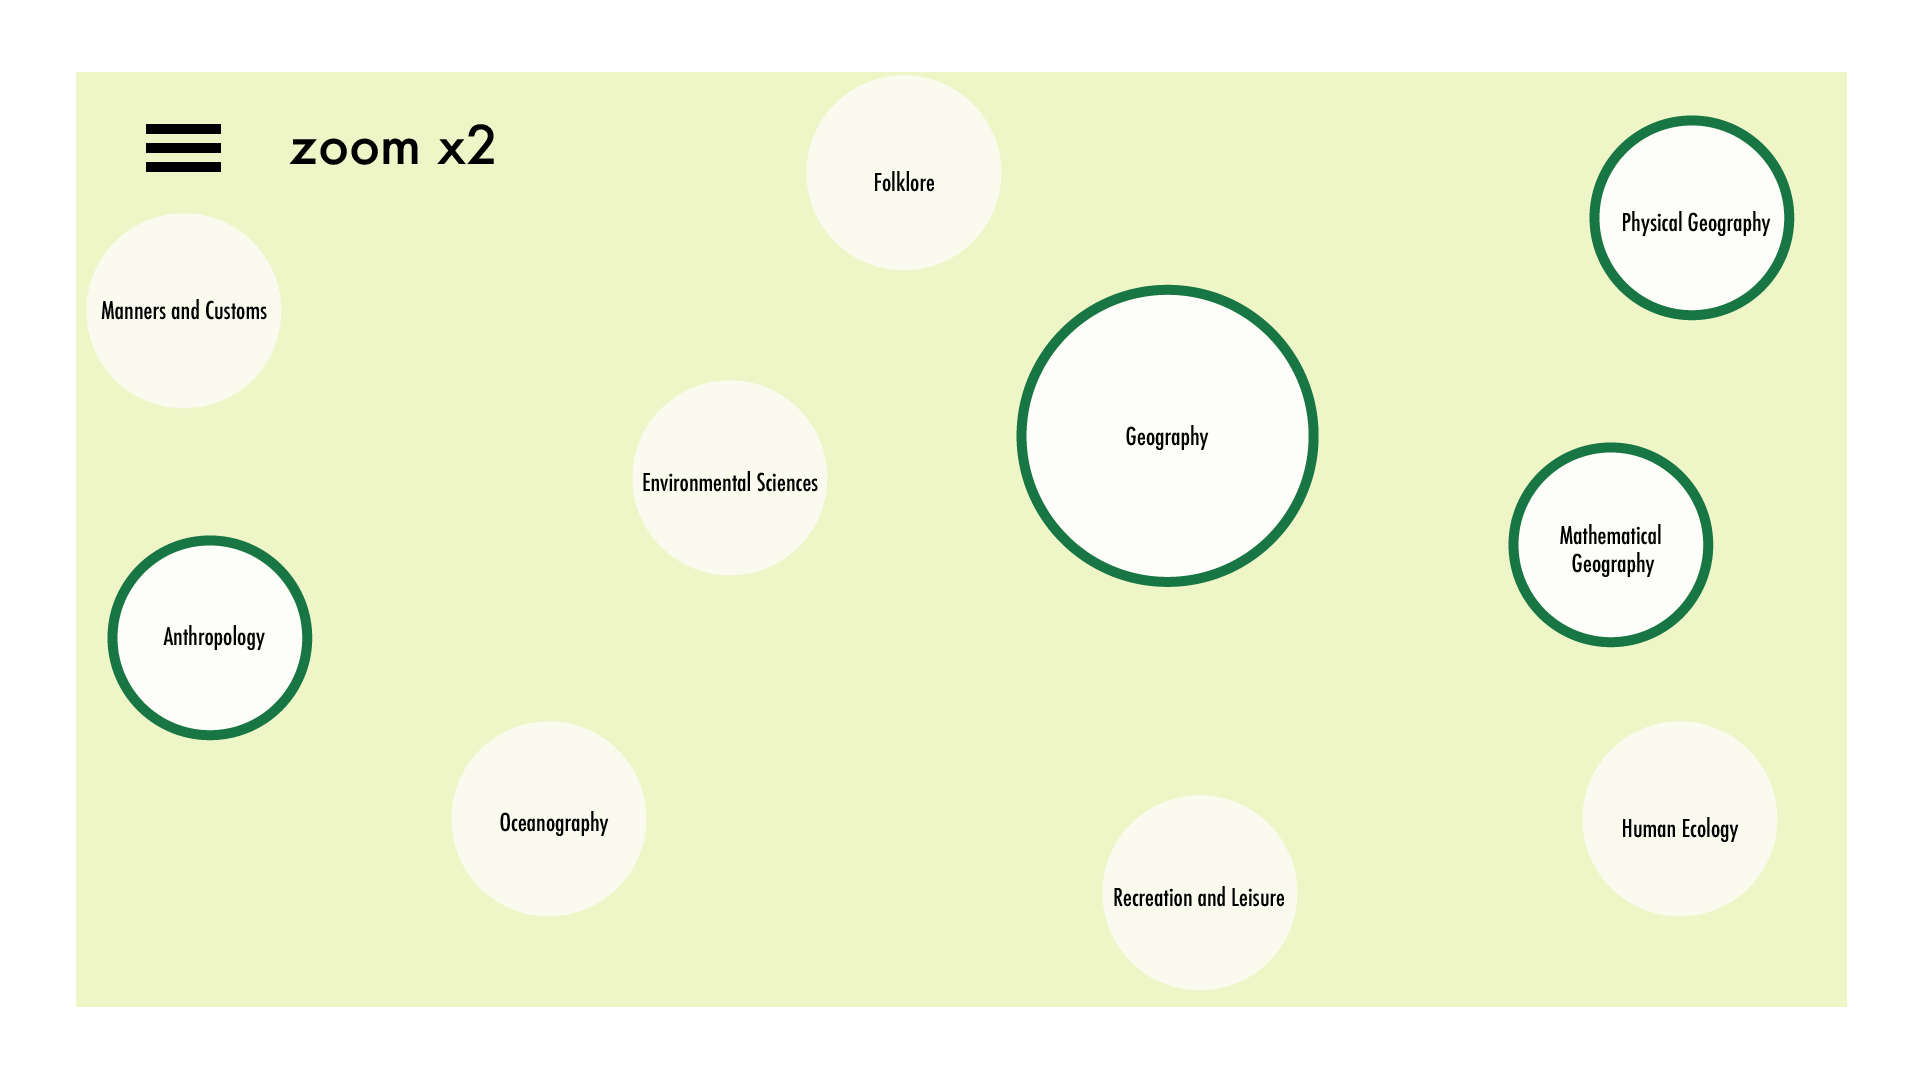
1. Begin with a high level overview of all topics covered in a library
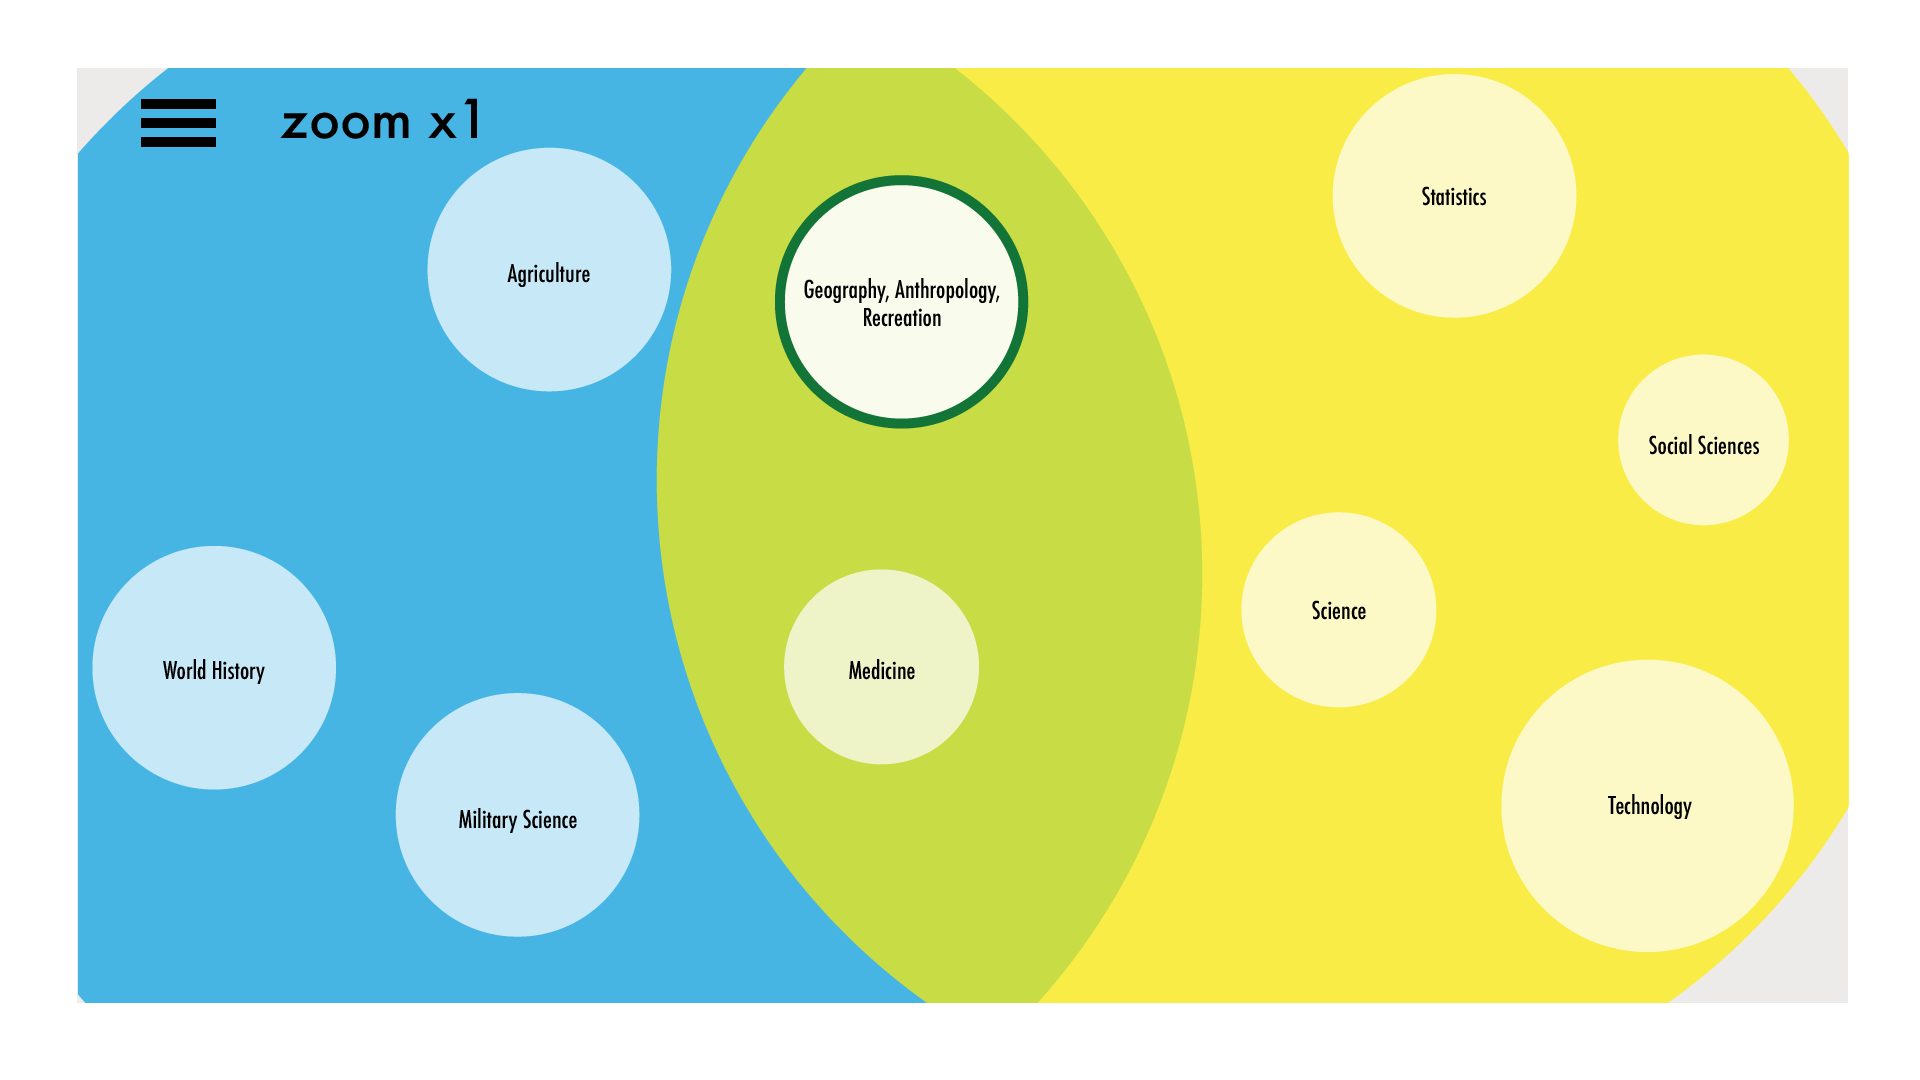
2. Clicking on the intersection of two topics zooms into subtopics in the library
3. Clicking a subtopic zooms deeper into the library
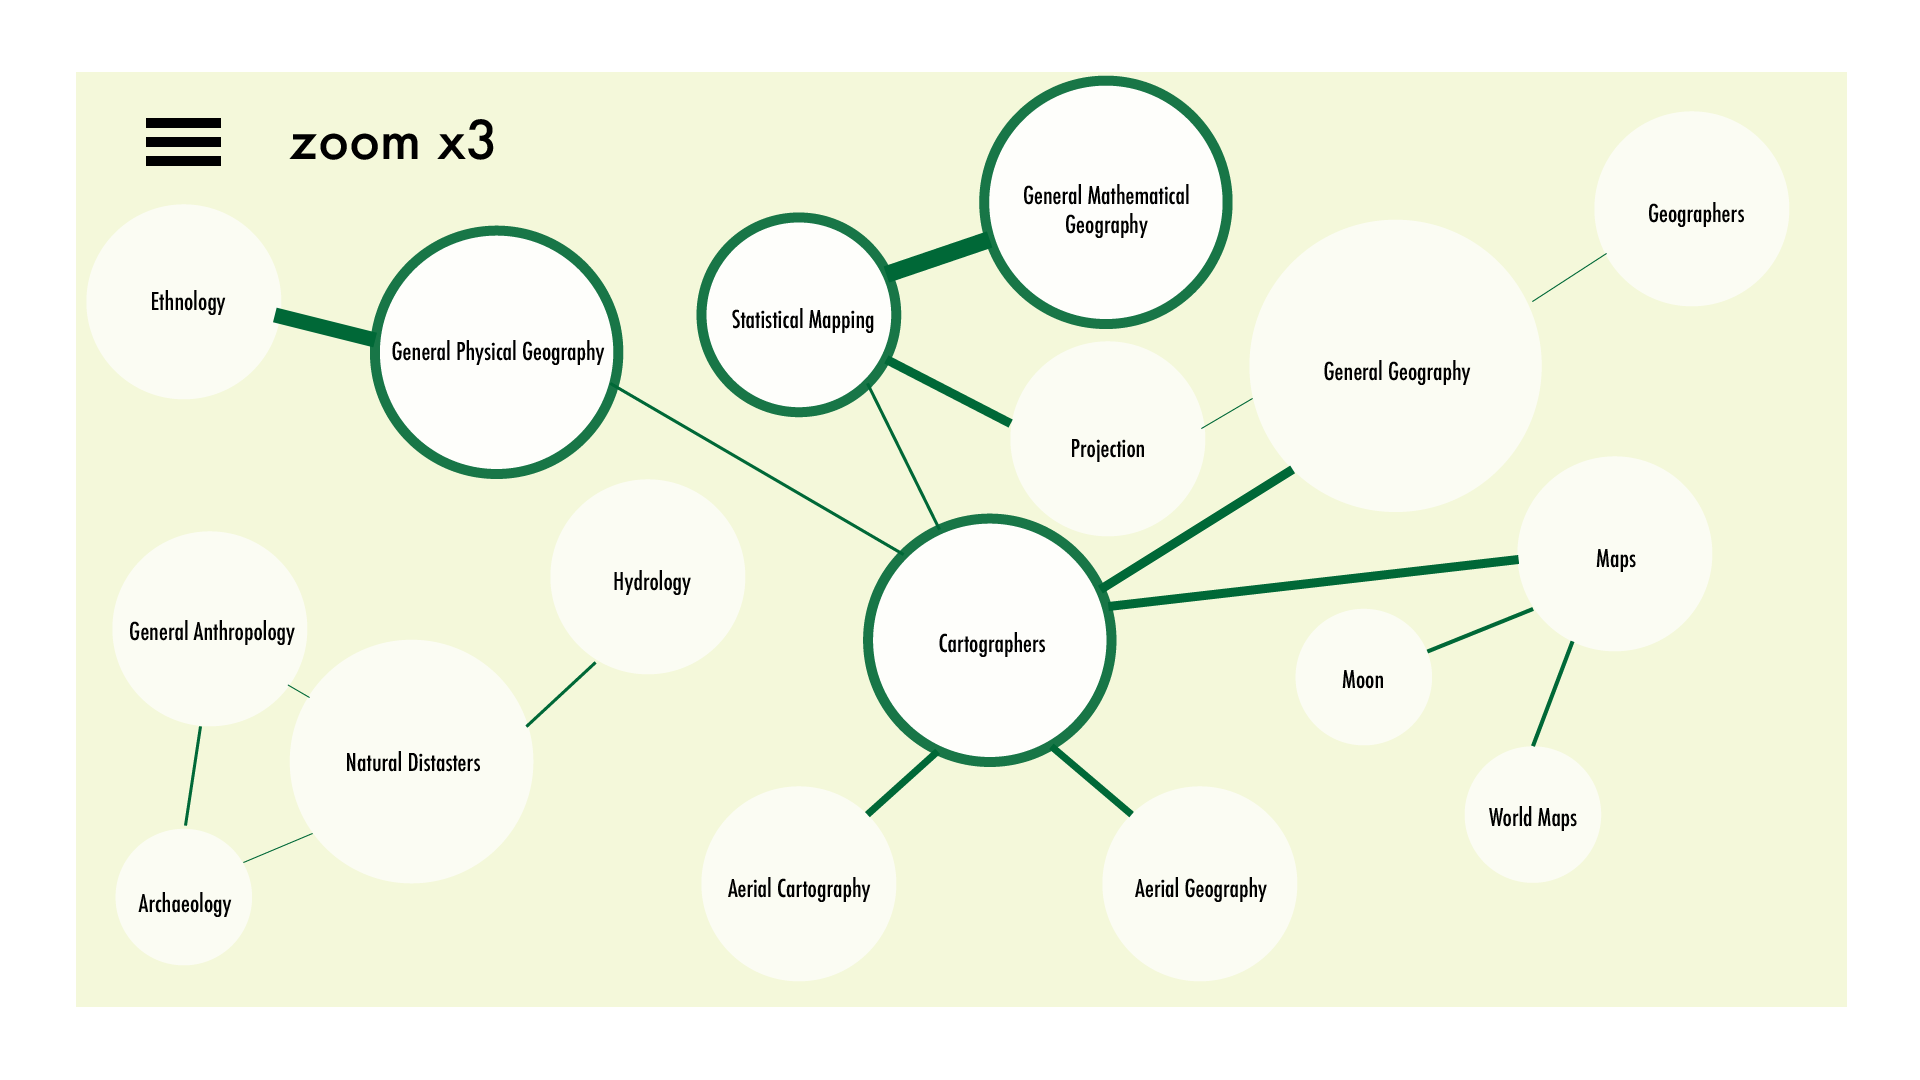
4. After zooming three times, links appear to indicate overlap between topics
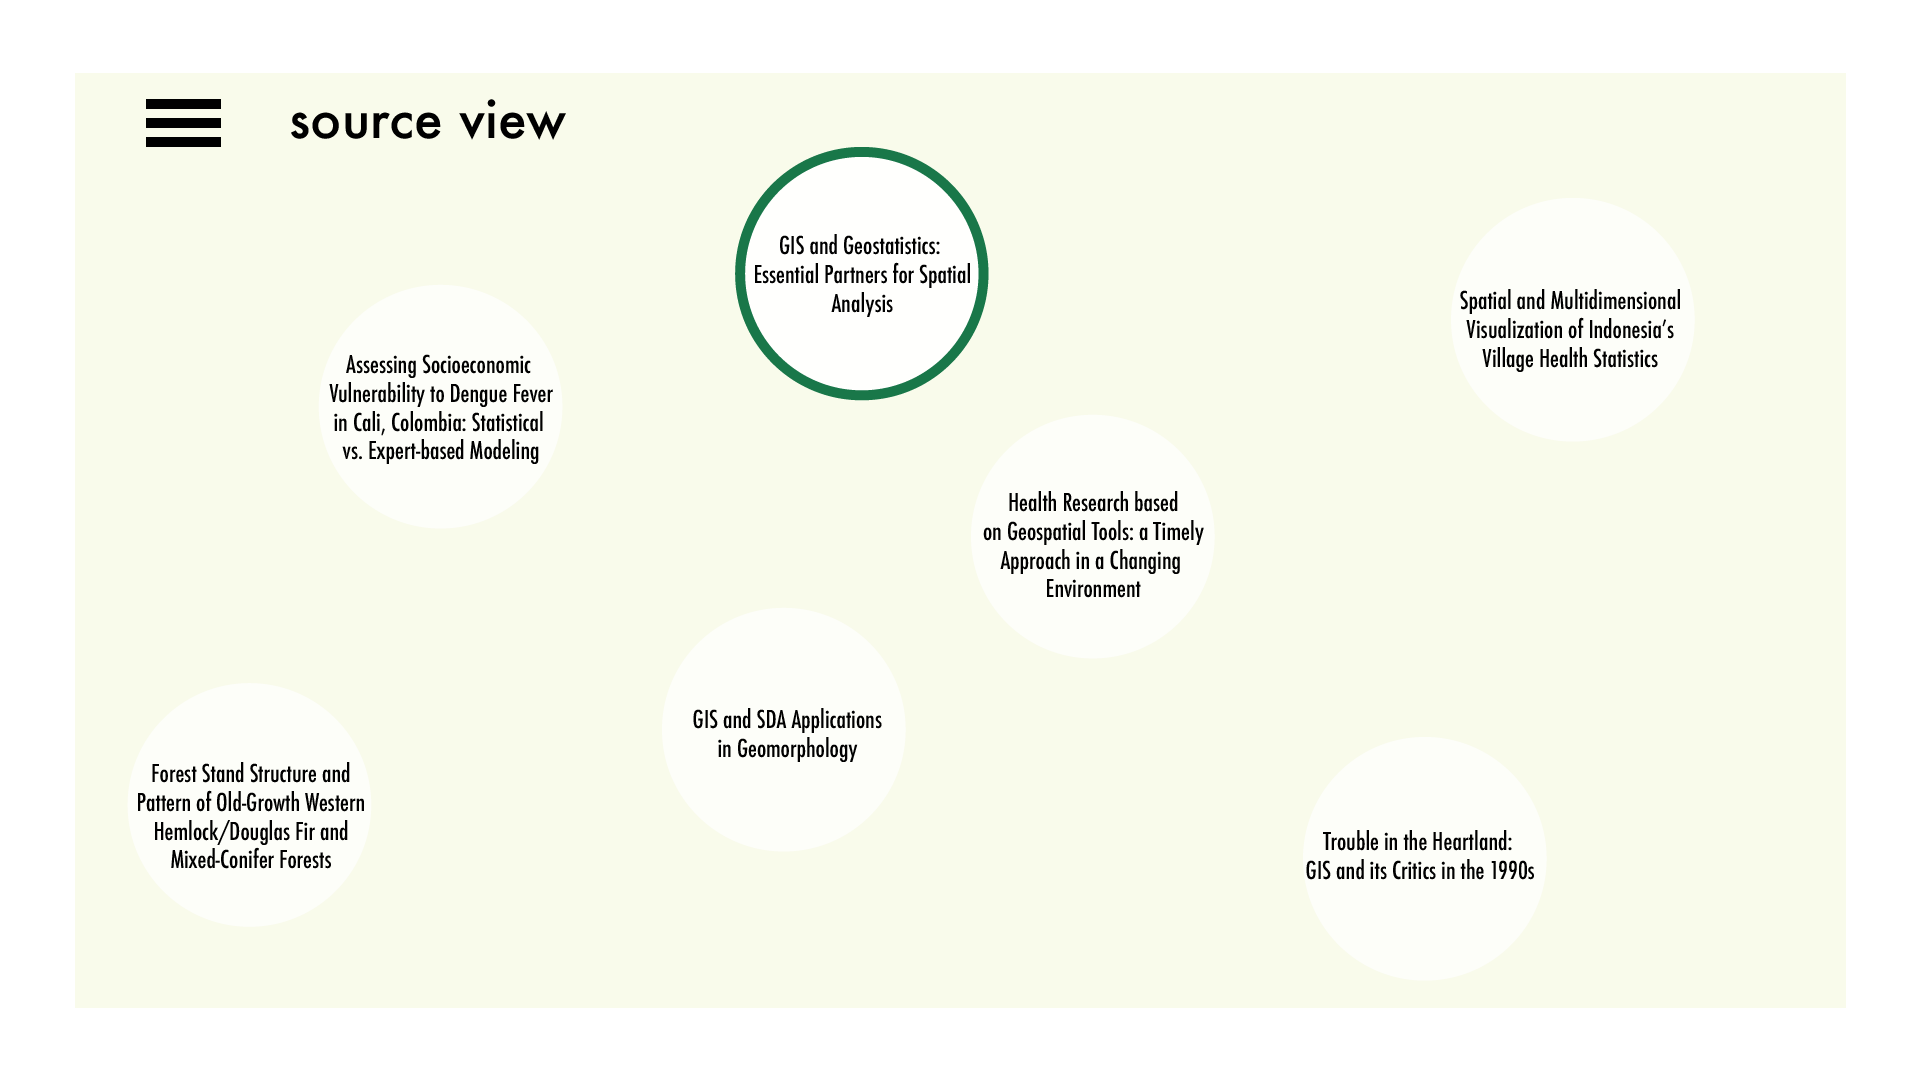
5. Clicking once more displays links to library items (books, articles, videos, etc.)
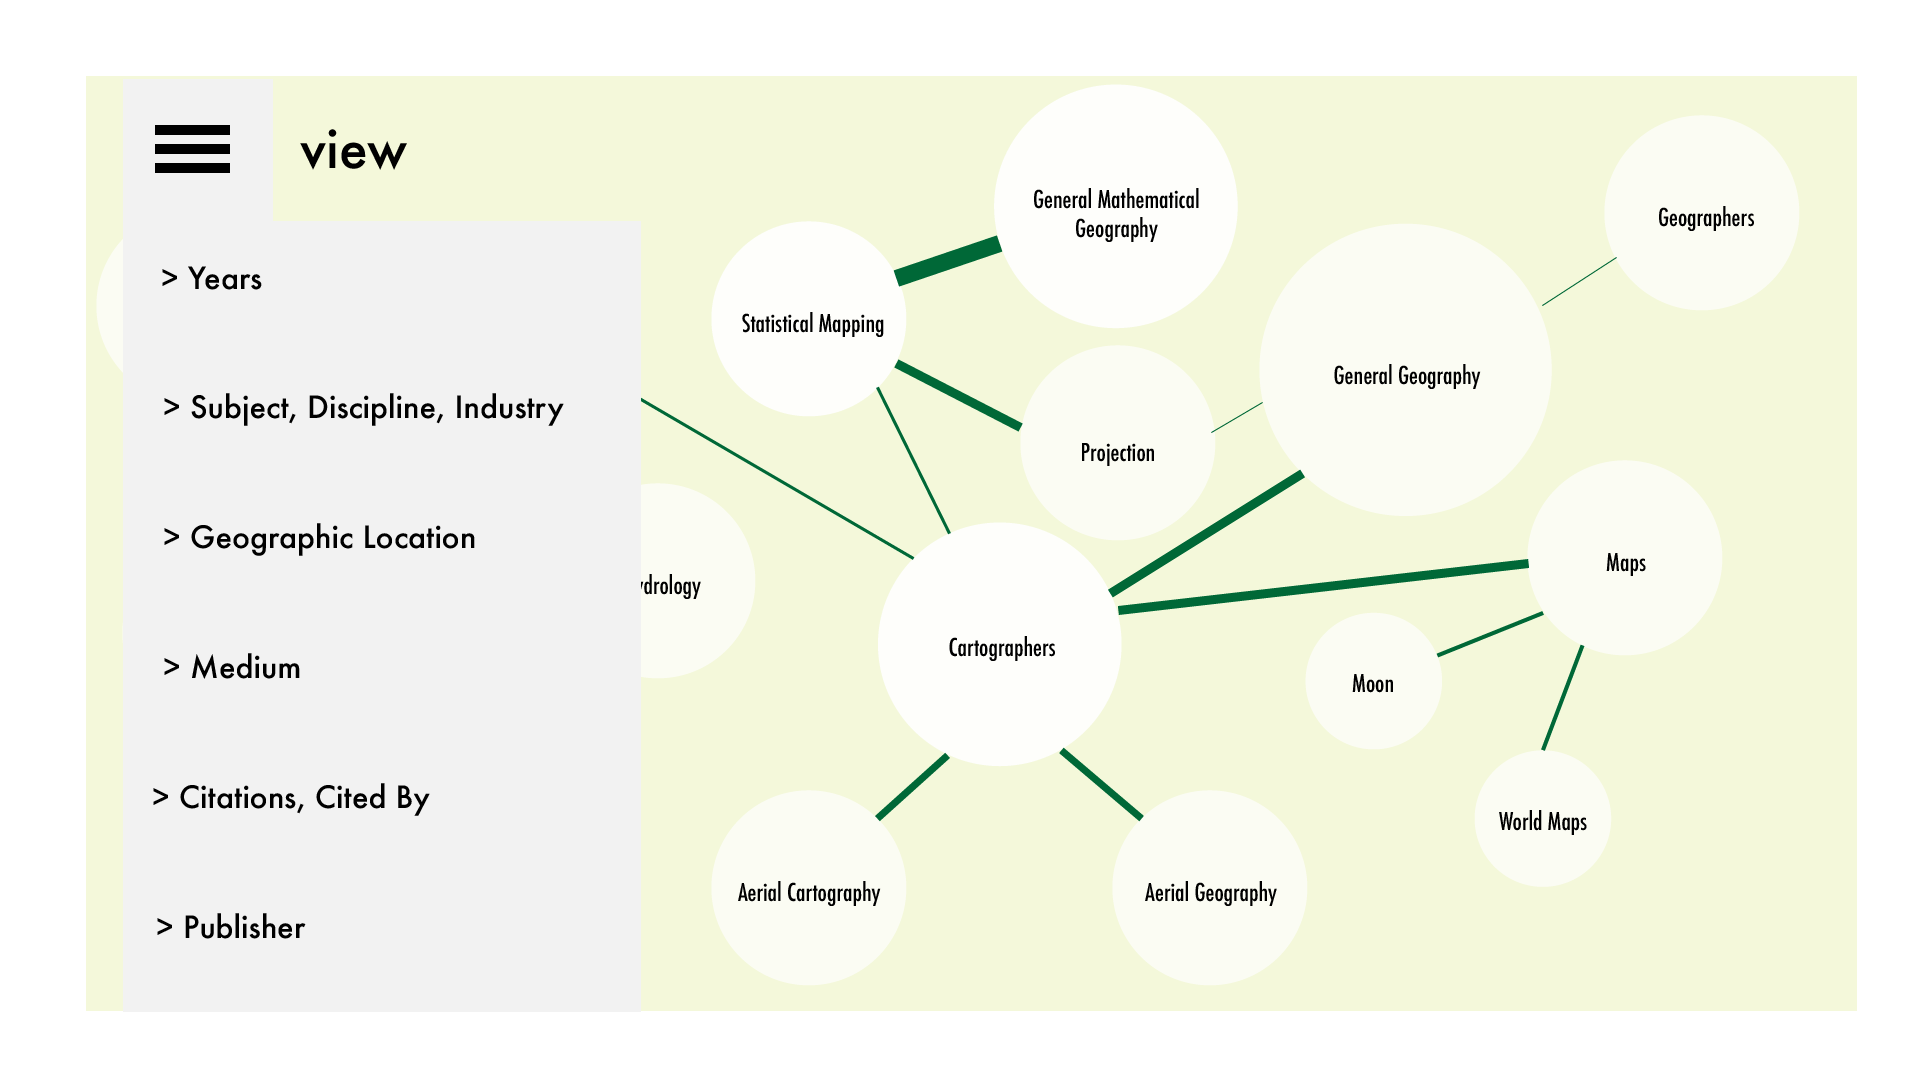
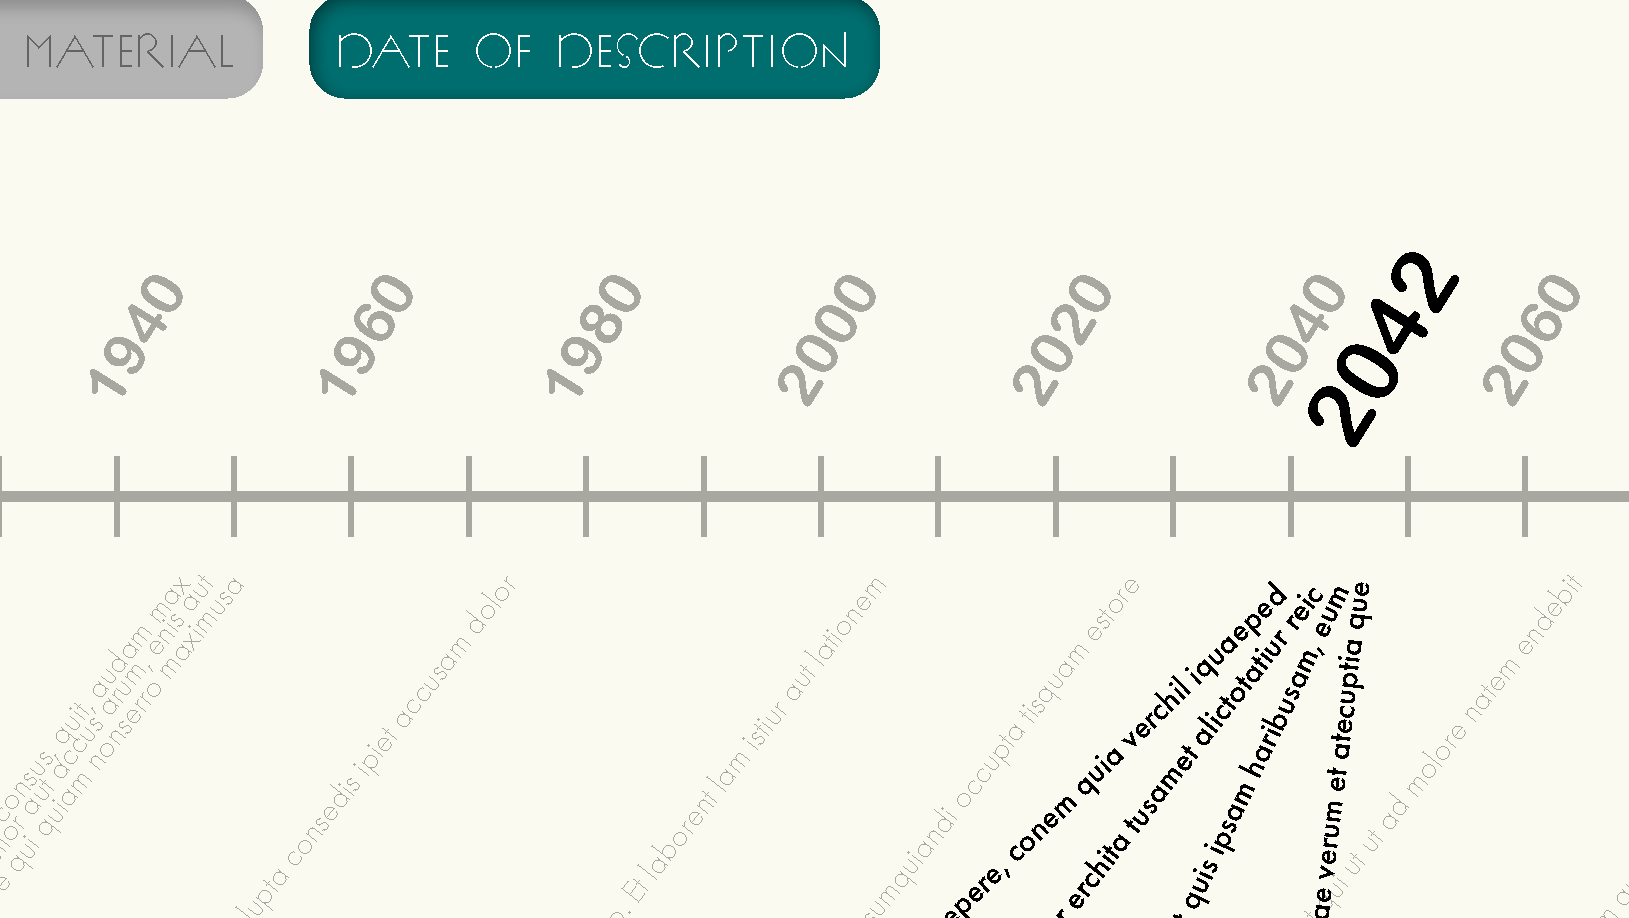
When using the Contextual Search Engine, users may select filters to narrow the library items displayed
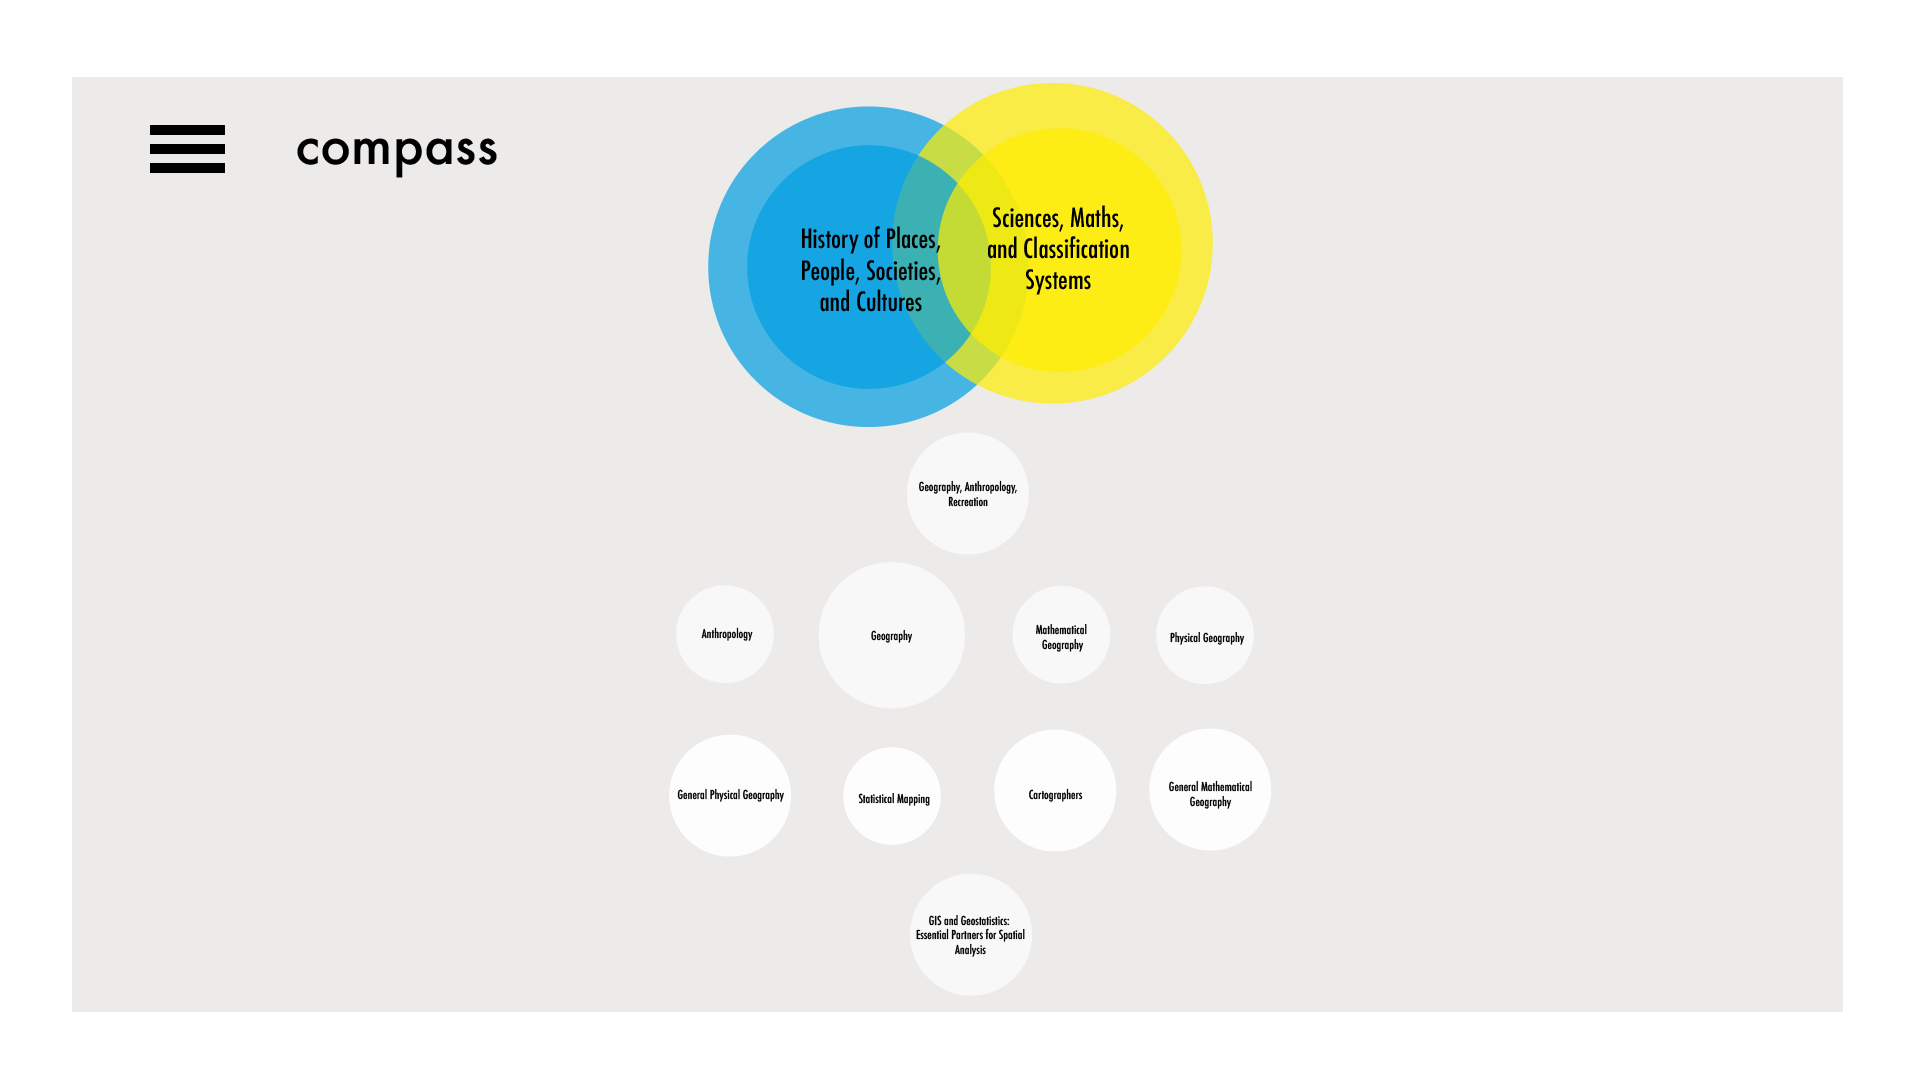
The compass view visualizes a user's path through the Contextual Search Engine
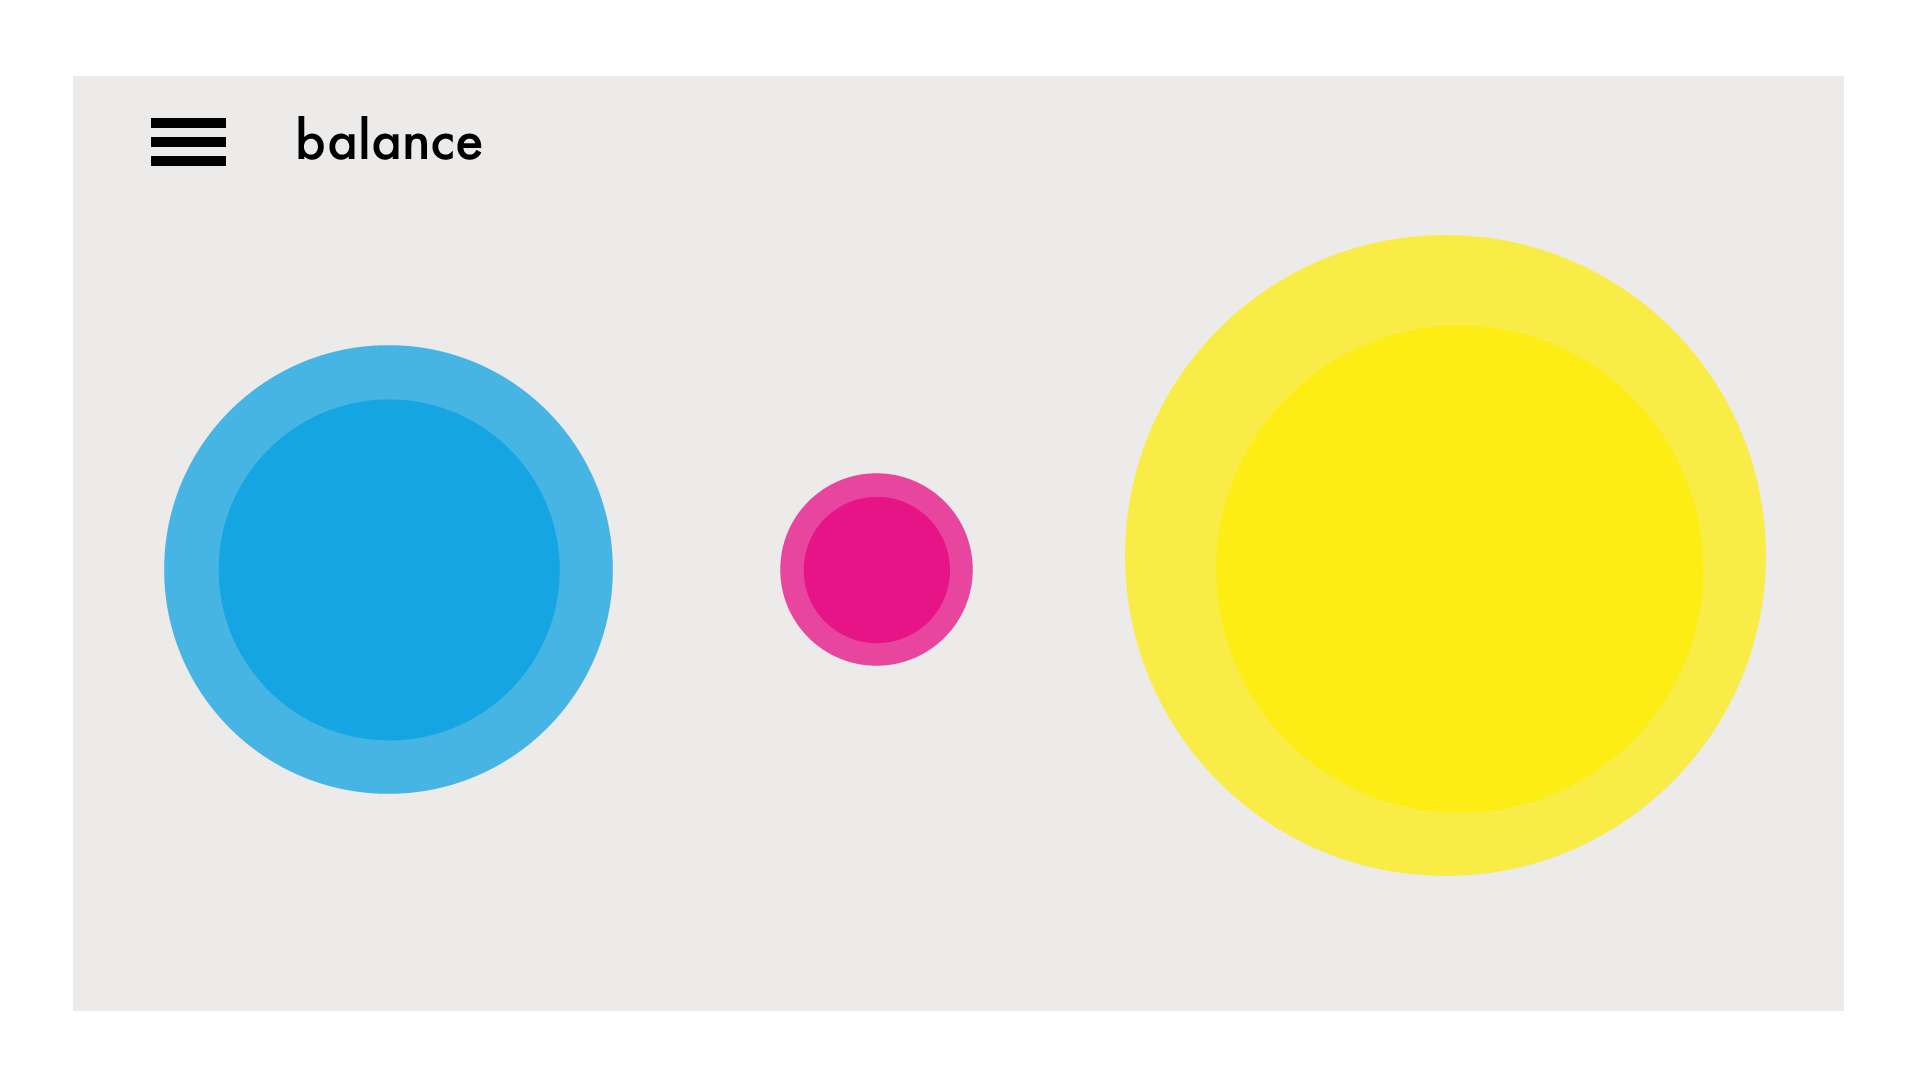
The balance view visualizes how many library items a user has viewed by topic, promoting a broad collection of disciplinary perspectives in research
Created with Adobe Illustrator
Citations
Sarjakoski, L., 2007. Conceptual Models of Generalisation and Multiple Representation. Generalisation of Geographic Information, pp.11-35.
Archer, E. & Barnes, G., 2017. Revisiting Sensemaking: The Case of the Digital Decision Network Application (DigitalDNA). The International Review of Research in Open and Distributed Learning, 18(5).
Levy, M. & Mole, T., 2015. The Broadview Reader in Book History, Peterborough, Ontario: Broadview Press.
Lima, M., 2013. Visual Complexity: Mapping Patterns of Information, New York: Princeton Architectural Press.
Regalado, A., 2013. Big Data Gets Personal. MIT Technology Review. Available at: https://www.technologyreview.com/s/514346/the-data-made-me-do-it/ [Accessed December 3, 2017].